In the past, adding a vector map to a WordPress site has been a complicated task. Editing vector files, using APIs, or installing Javascript libraries – adding a responsive map became complicated very quickly.
There were a small handful of map plugins, but none that did the job without a lot of configuration, or again, API connections. But now there’s an excellent (and free!) plugin that does a beautiful job of vector mapping; it’s called Interactive Geo Maps.
Creating a world subdivisions map, or a map of a specific country with Interactive Geo Maps is easy. You can do it in 15 minutes, without an API or fiddling with additional scripts.
You can customize the appearance of regions, add tooltips, even add URLs to regions to make them clickable.
Let’s go through the steps for creating a map so you can see how it works.
Installing the Interactive Geo Maps Plugin
Nothing unusual here, just follow the usual plugin installation steps.
Log in to your WordPress admin panel.
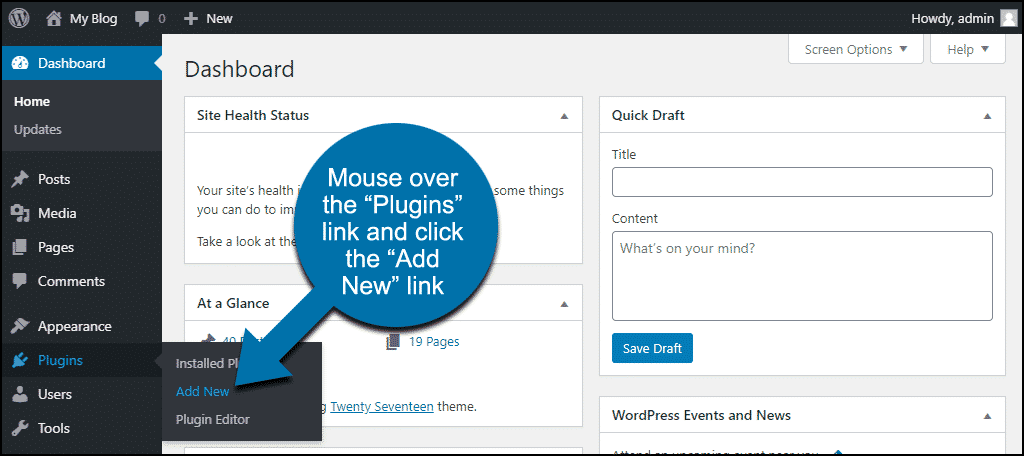
In the left column navigation, mouse over the “Plugins” link and click the “Add New” link.
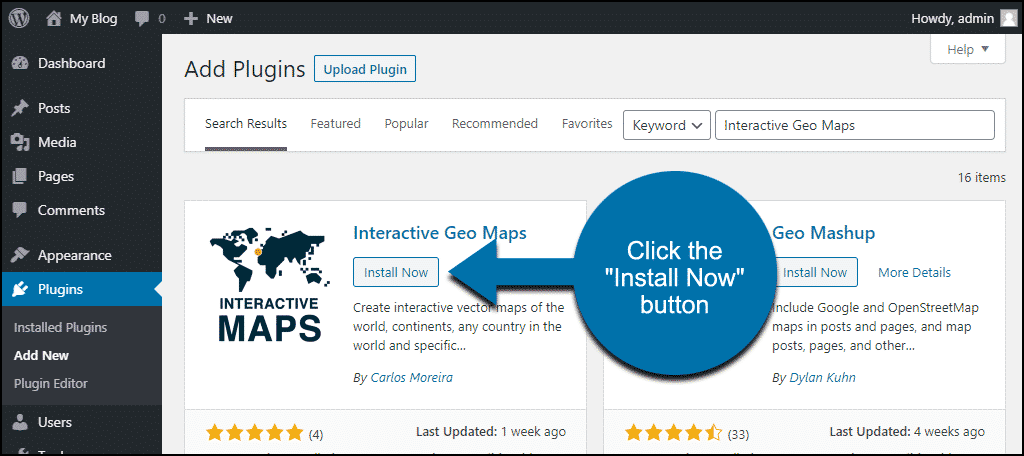
In the “Search plugins…” box, enter, “Interactive Geo Maps.”

Once you have located the plugin, click the “Install Now” button.
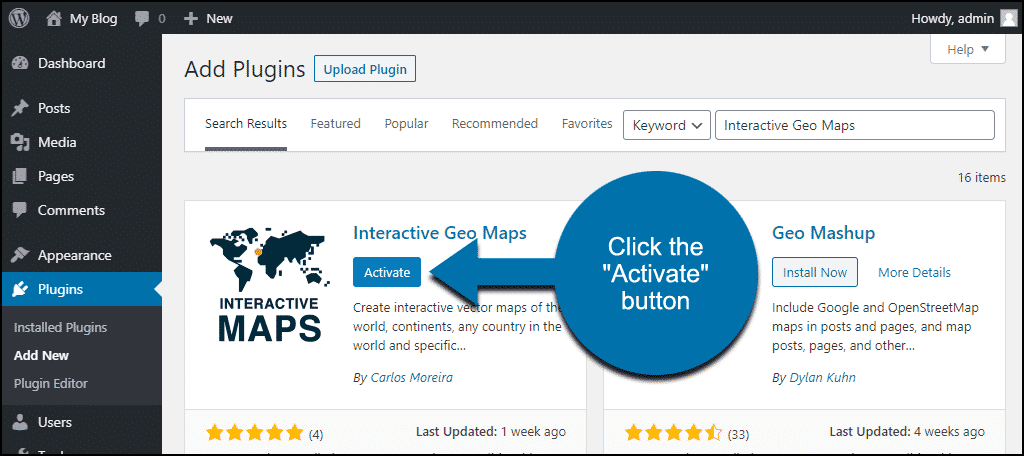
Finally, click the “Activate” button.
Using Interactive Geo Maps
Creating a new vector map only requires a few steps.
- Choosing the map
- Defining the regions
- Publishing the map
While those are the only required steps, we’ll also add markers to highlight specific locations inside a region.
Let’s get started.
Create a New Map
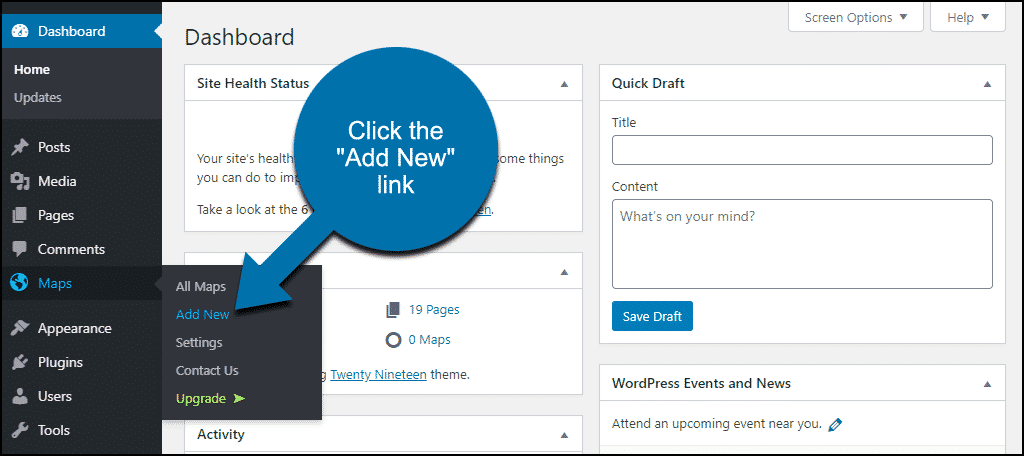
In the left column navigation, mouse over the “Maps” link and click the “Add New” link.
Give the map a title.
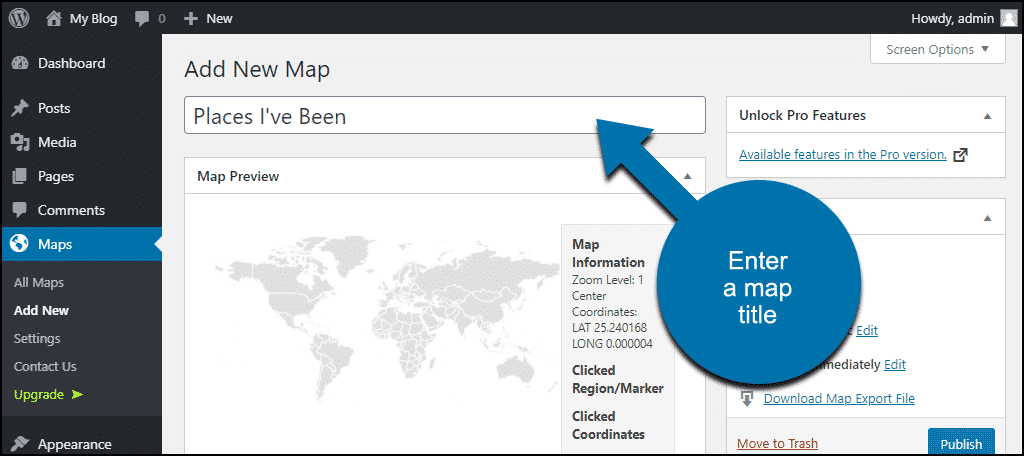
Now, let’s choose what’s shown on our responsive vector map.
Select a Region Map
By default, the plugin displays a world map. But there are hundreds of maps available to choose from.
Scroll down the “Add New Map” page to the “Map Settings” section.
Click the “Map to display” drop-down to see the available maps.

As you’ll notice, there are at least two versions of most maps, “High” and “Low.” That refers to the detail contained in the map image.
The “High” version of the map requires a larger file than the “Low” version. So, of course, the “High” image will take longer to load.
You’ll have to decide how to balance detail vs. performance for your maps. A busy site or a site with a lot of mobile traffic will benefit by using the smaller (“Low”) files.
For this demonstration, I’m going to use “World Great Lakes Ultra.” The “Ultra” files are even larger than the “High” files, but since this isn’t a live site, it’s okay.
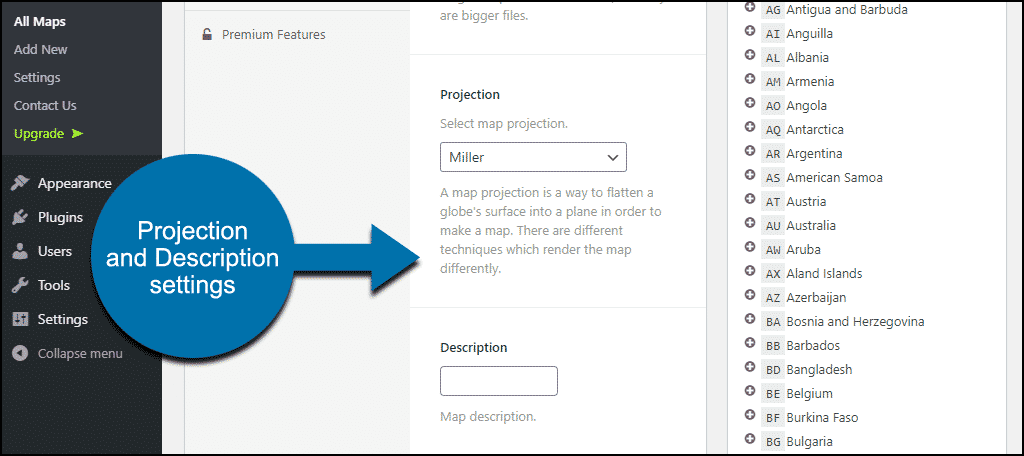
Projection
The “Projection” setting changes the way the map is represented.
The “Miller” setting is the default projection, and I’m going to leave that be for now. But if you prefer a Mercator projection, that’s available, as well as AlbersUSA, if you’re working with a map of the United States.
You can add a description to the “Description” field to help you keep track of multiple maps. Since we’re just making one, I’ll leave that blank.
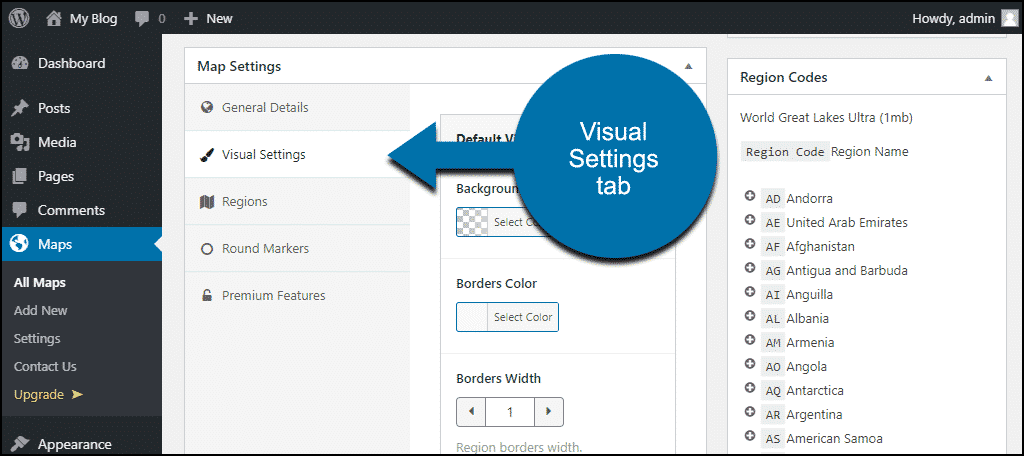
The Visual Settings Tab
Here’s where you set some of the map display options. I’m going to leave the default settings here, but you can change:
- Background Color
- Borders Color
- Borders Width
- Map Height
- Map Max-Width
- Font Family
Defining Regions on the Map
Now for the fun part. This is where we add interactivity to the map.
If we saved the map before defining regions, it would be visible, but there wouldn’t be any interactive elements.
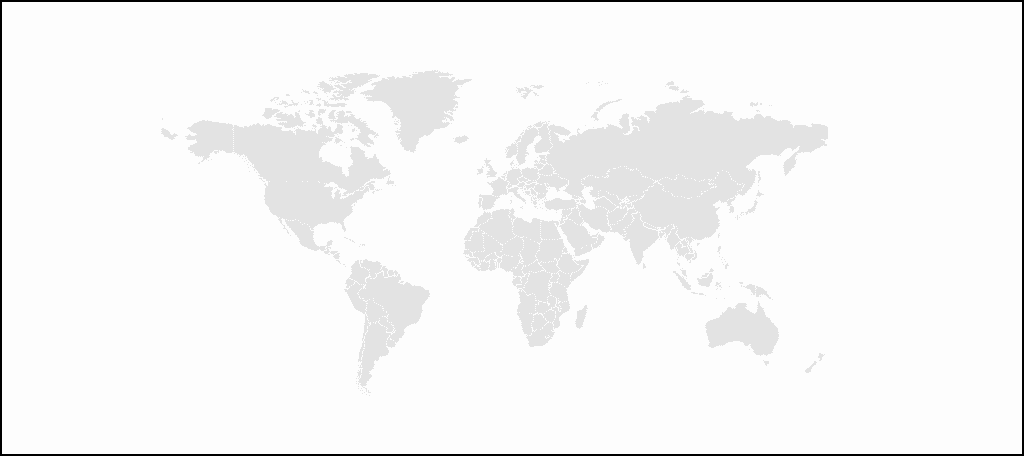
Looks nice, but it doesn’t do anything when we mouseover or click. Let’s fix that.
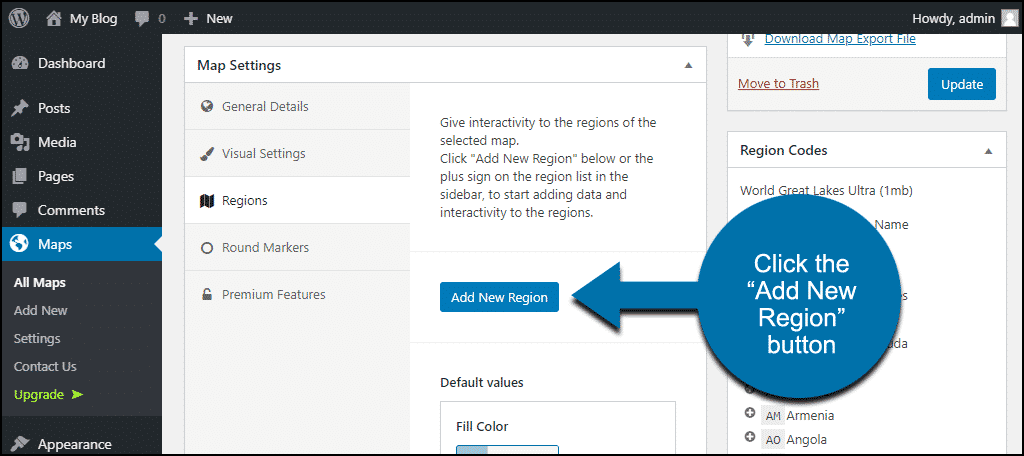
Click the “Regions” tab.
You’ll see the list of default values starting with fill, hover, and empty colors. You can change the values here. I’m going to leave the defaults.
The next value is “Click Action,” and we are going to change that. It controls what happens when a region is clicked.
We’ll set the Click Action to “Open URL (new tab),” that way we can add clickable URLs to the regions.

The final default values are to include or exclude regions.
Entering region codes (more on them in a minute) into “Include Regions” displays only those regions. The rest of the map disappears.
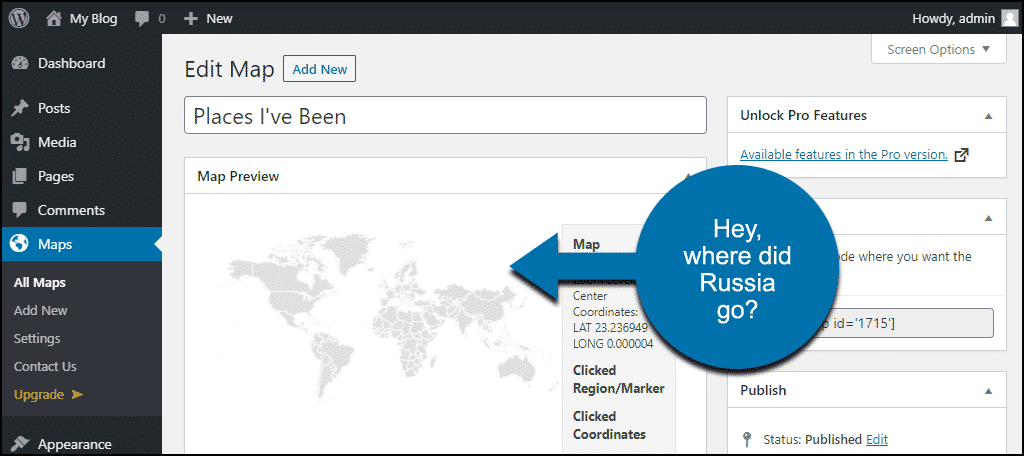
Entering region codes into “Exclude Regions” removes those areas from the map altogether.
For example, if we enter RU into “Exclude Regions,” Russia disappears from our map.
Okay, Let’s Add a Region
There are two ways to add a region to our map. We can click the “Add New Region” button and search for one, or select a region from the list of those available in the right column.
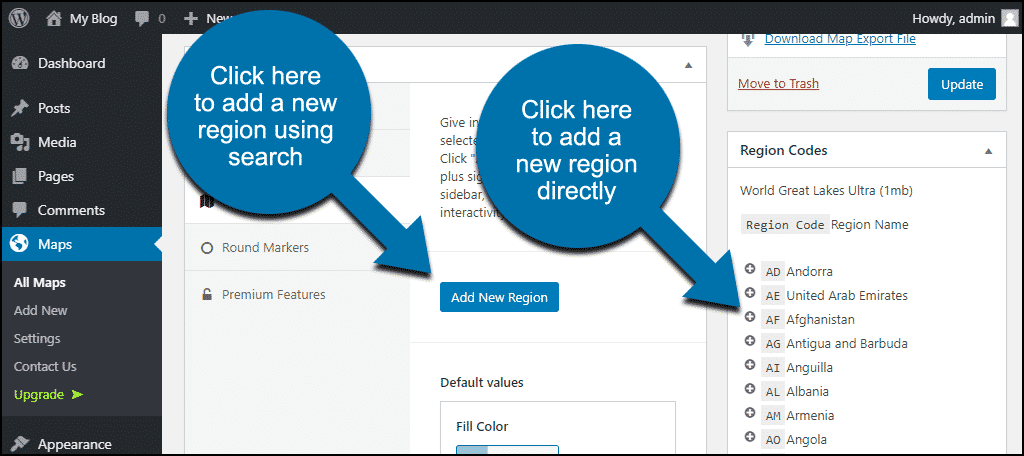
Let’s go over each method, and you can decide which one works best for you.
Adding a Region by Clicking the “Add New Region” Button
Start by clicking the “Add New Region” button.
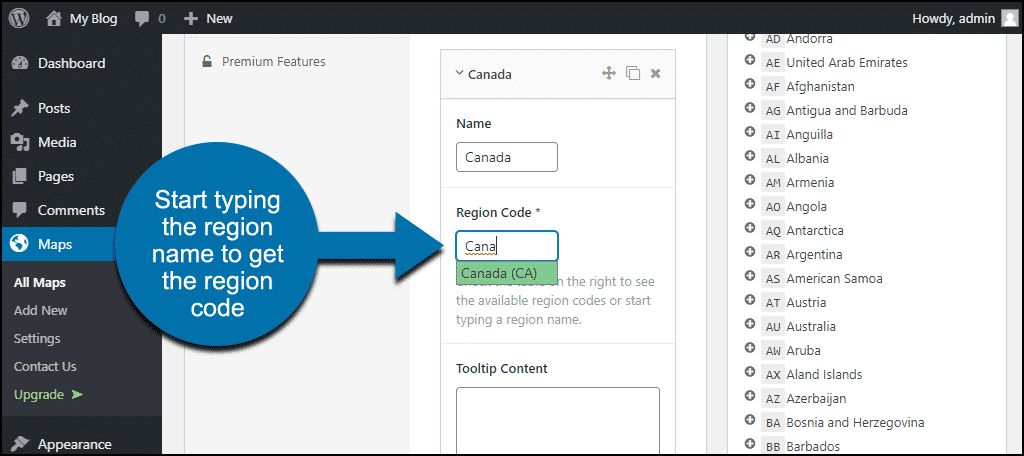
In the “Name” field, add the region name.
Start typing the region name in the “Region Code” field, and the region selection will pop up.
Here I’m typing “Canada,” and you see the Canada selection appears in green, which includes the region code (CA). Click the green field to add the country code.
If you type your region and no code shows up, that means that the region is not available on the map. Try a nearby area, or check the list in the right column.
The “Tooltip Content” field is where you enter the text that you want to be displayed when someone hovers over the region.
In the “Action Content” field, you can enter a URL that will open when the region is clicked.
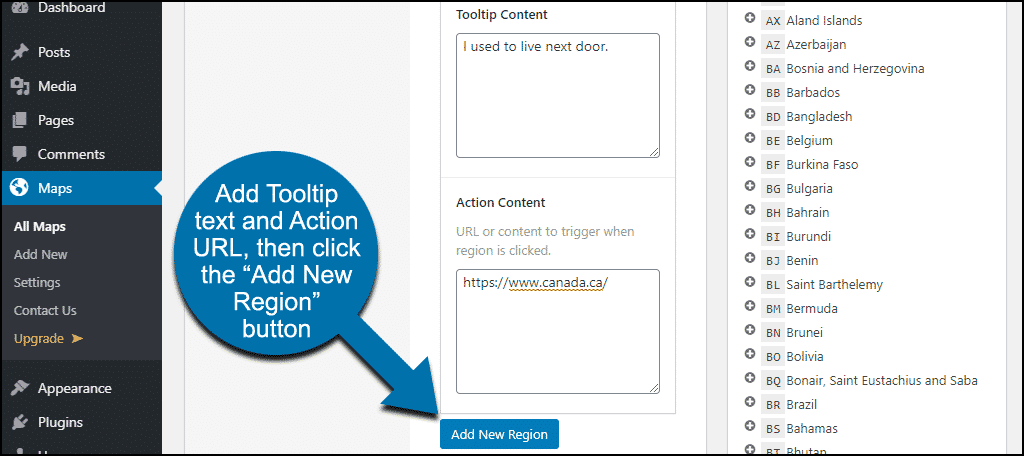
Click the “Add New Region” button.
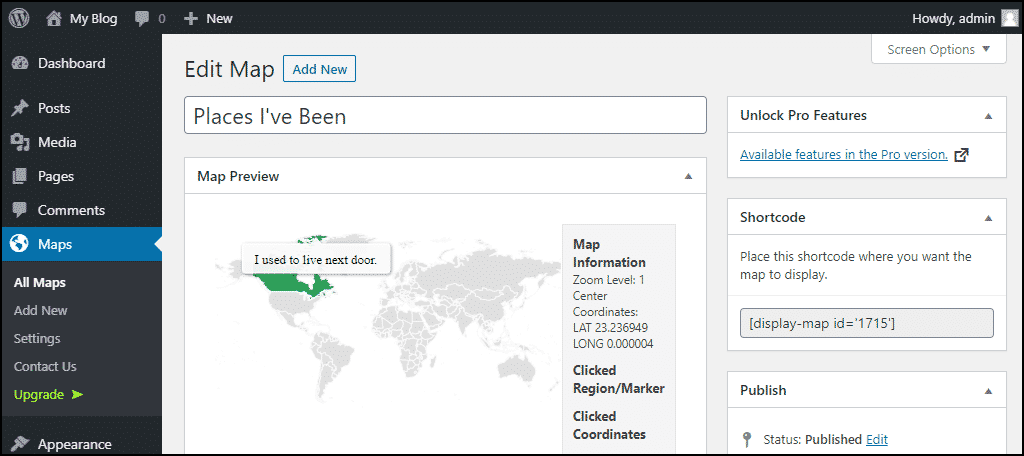
Now Canada is active in our preview map, and if you mouse over it, you can see the tooltip.
Adding a Region by Clicking in the Region List
The second way to add a region is to click the “+” icon next to the region in the right column. This is the method I prefer since it prepopulates some of the fields.
So to add Switzerland, we’ll scroll down until we find it and click the +.
![]()
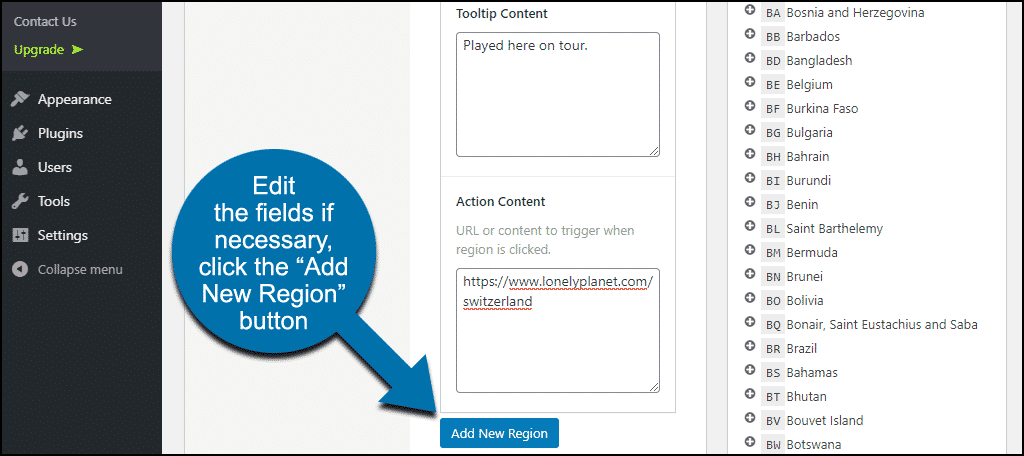
Now you can see that the Name, Region Code, and Tooltip are already filled in. You can edit the Name and Tooltip, and add an Action URL.
Click the “Add New Region” button.
You can continue to add regions using either of the methods.
Adding Zoom to the Map
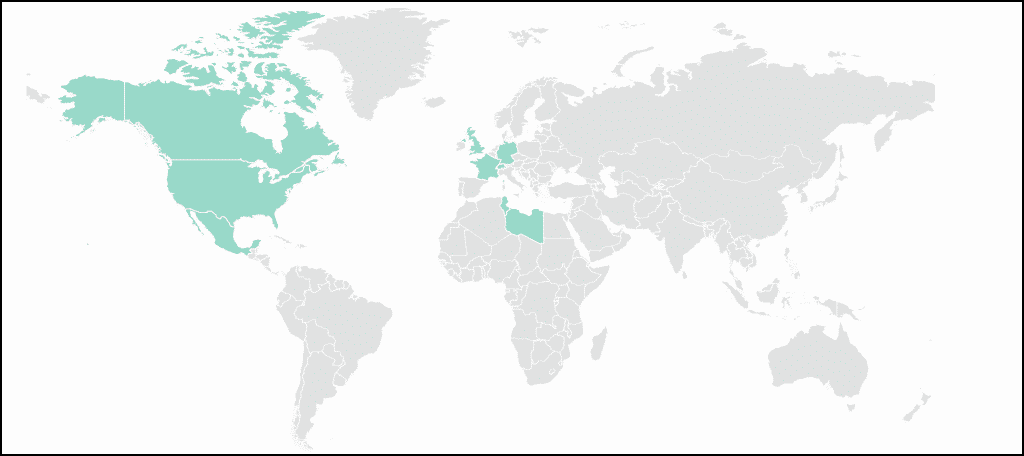
After adding a few more regions, our map is starting to look more complete.
But what if we want to take a closer look at some regions? There’s no zoom function by default, but it’s easy to add.
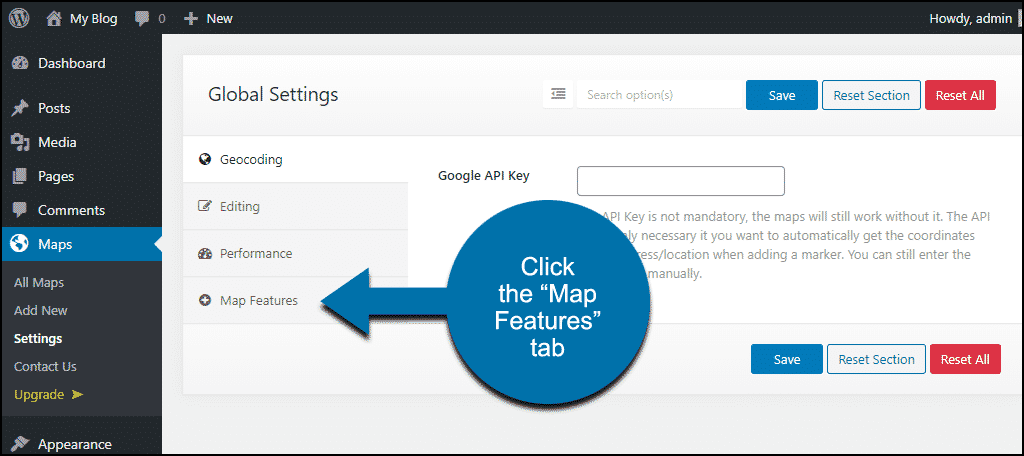
Go to the Settings section of the plugin and click the “Map Features” tab.
Click the “Zoom” toggle to turn it on, then click the “Save” button.
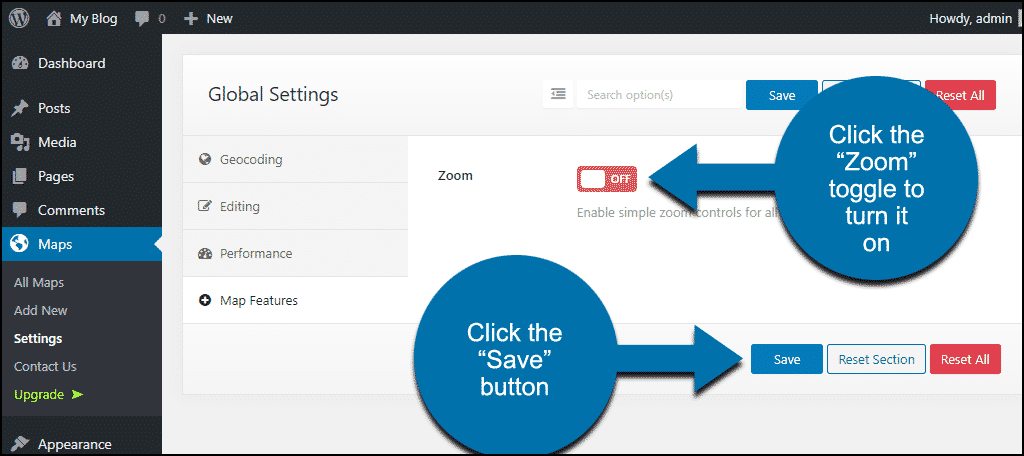
Now when we view the map, we can zoom in and out.

Add Location Markers
Defining our regions and adding text and links makes for a cool map. But we can make it even better by adding some location markers and information.
In our demo here, I’ve defined some countries I’ve visited, but how can we add the cities as well?
There are two ways to add location markers, and both are done on the “Round Markers” tab.
First, you can click on the map in the “Map Preview” to set a marker.
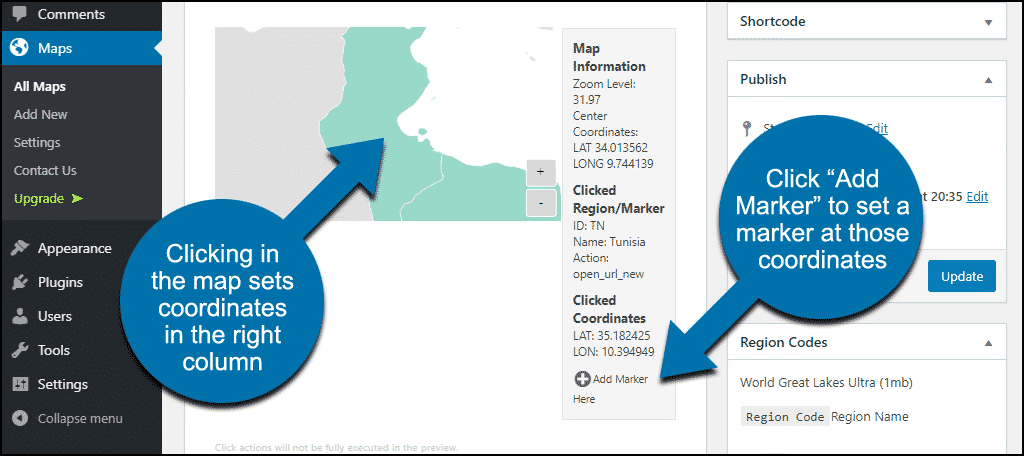
That’s easy and convenient, but not very accurate.
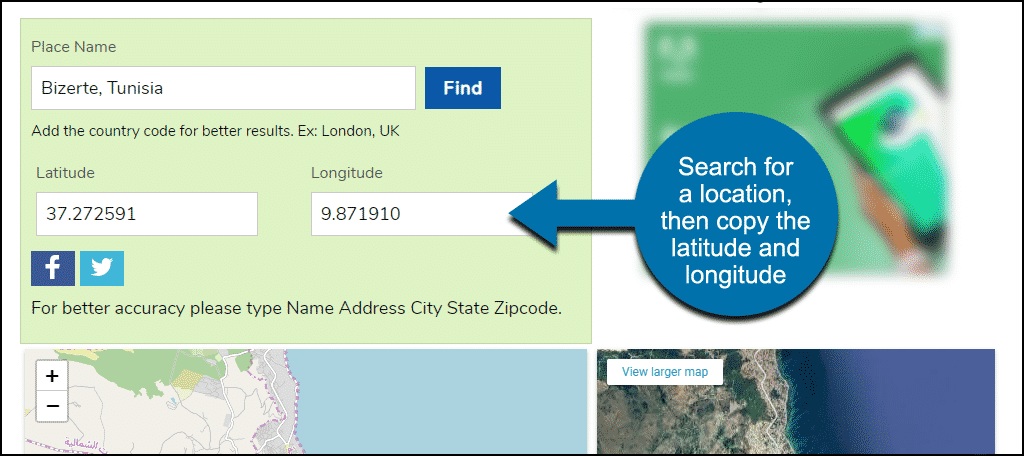
The second method requires a little more effort, but I prefer it for its accuracy. You’ll need the latitude and longitude for the location.
The plugin recommends the Latitude and Longitude Finder site, so that’s what we’ll use.
Adding locations will be easier if you open the Latitude and Longitude Finder site in a separate tab.
We’ll search for the latitude and longitude for the city we want to mark, then switch over to the plugin.
In the “Round Markers” tab, click the “Add New Marker” button.
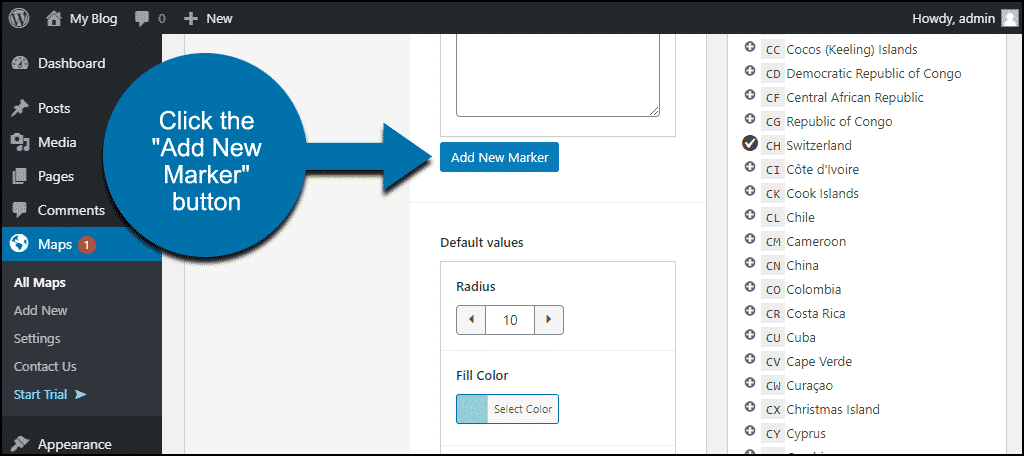
You can see the fields are almost the same as when we added regions. The only difference is the additional fields for latitude and longitude.
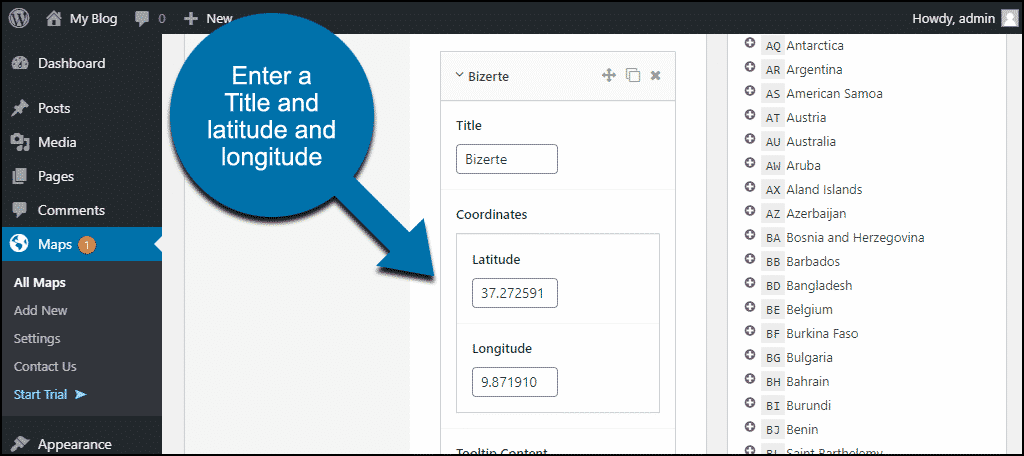
Add a Title, and if you’d like, the Tooltip, and Action Content. (If you add a URL to Action Content, don’t forget to set the Click Action in the section below.)
Then copy and paste the latitude and longitude from your lookup on the Latitude and Longitude Finder site.
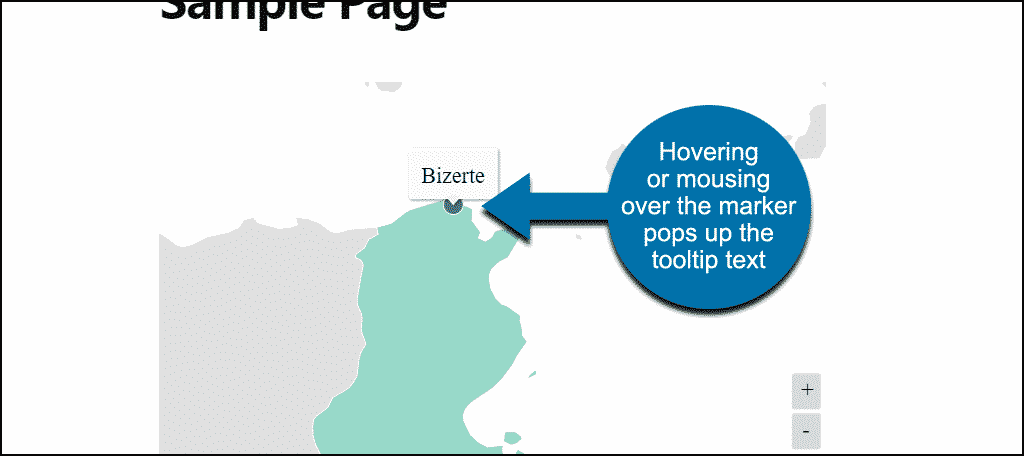
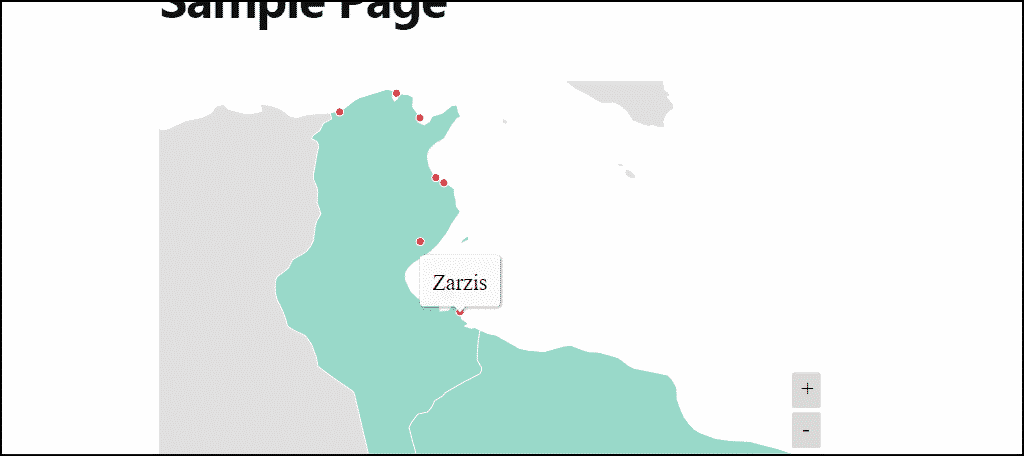
Now if we save the map, go to our site and zoom in to the region, we can see the marker.
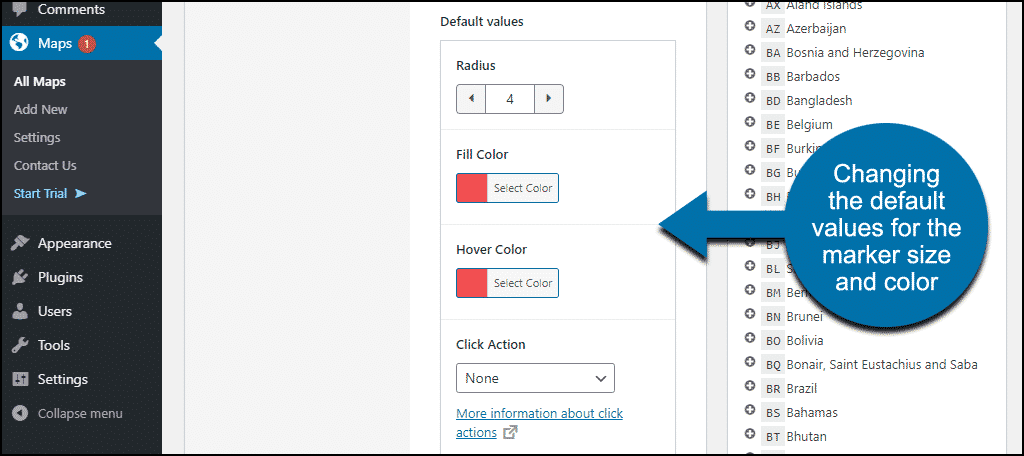
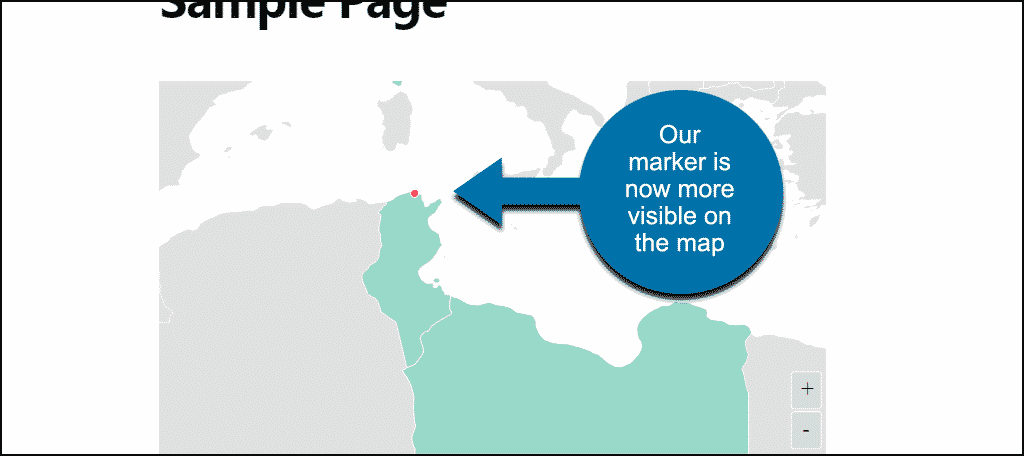
Changing the Marker Appearance
By default, the markers are the same color as the regions, and I find the dot a bit large.
To set a new marker color and make the marker dot smaller, change the default values on the Round Markers tab.
Now when we save the map, go to our site and zoom in to the region, the marker stands out from the region.
You can add as many markers as you’d like.
Be aware that there can be a negative effect on map loading speed when too many markers are plotted.
How many is “too many” depends on your site, host, etc., and will be different for every website.
Publish the Vector Map
Okay, we’ve been through a lot here together, haven’t we? Now it’s time to make our map visible on our site. As you might expect by now, there are a couple of ways to do that.
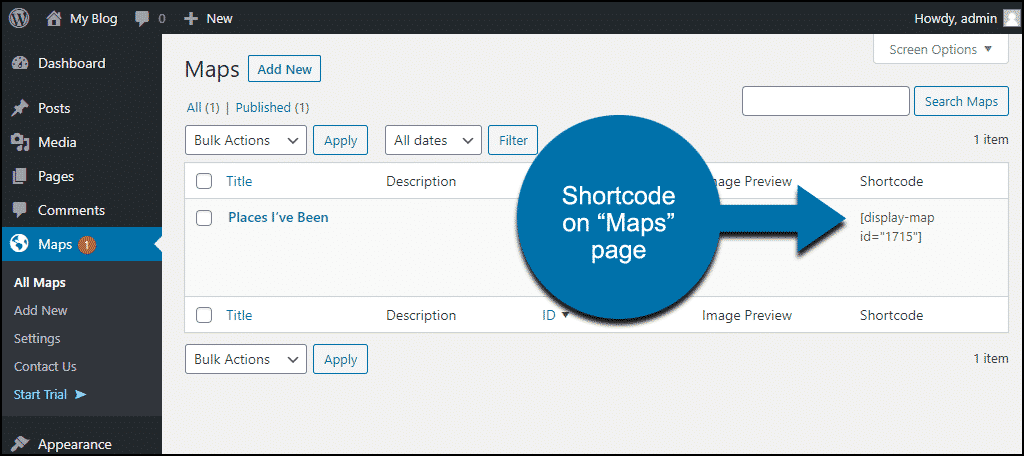
The first method is to copy the map shortcode into the page or post where you want it to appear. The shortcode can be found on the Maps page:
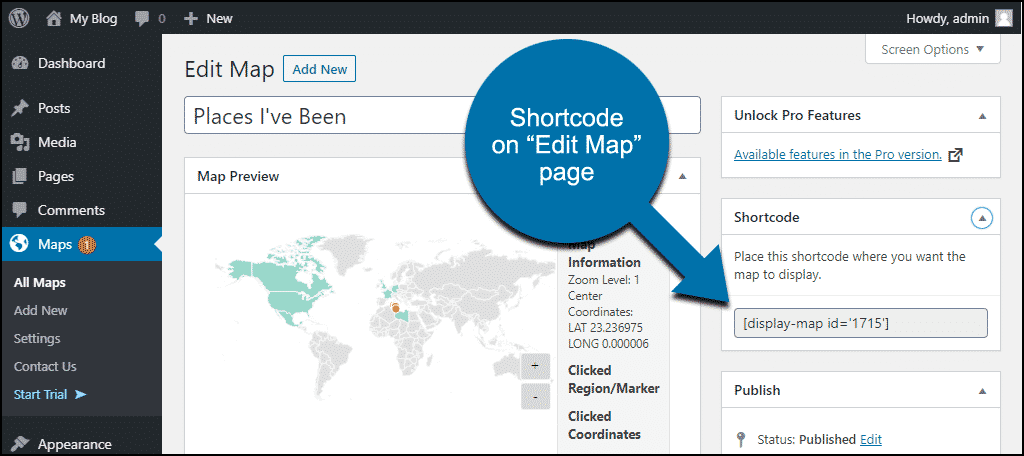
Or the Edit Map page:
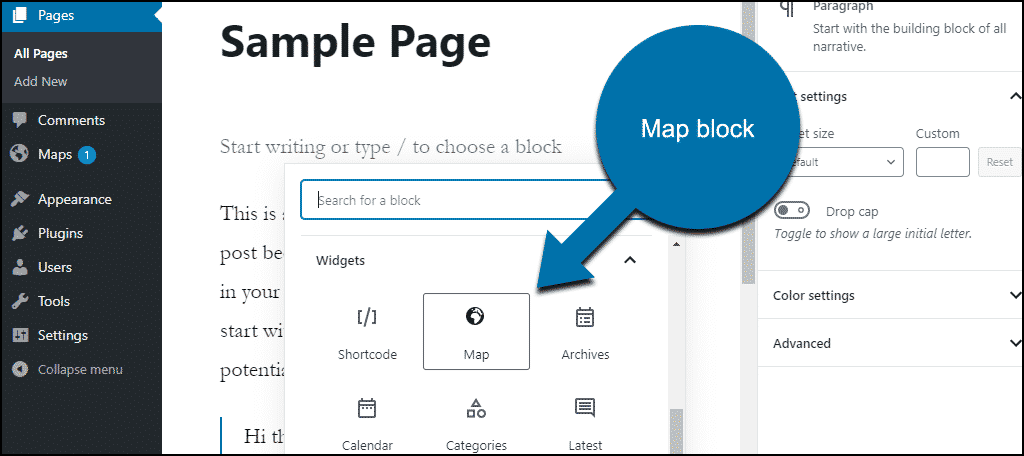
If you use the WordPress Gutenberg editor, the plugin creates a block.
You can find it in the “Widgets” section, it’s called “Map.”
When you add the block, you can select your map from the “Map to display” drop-down.
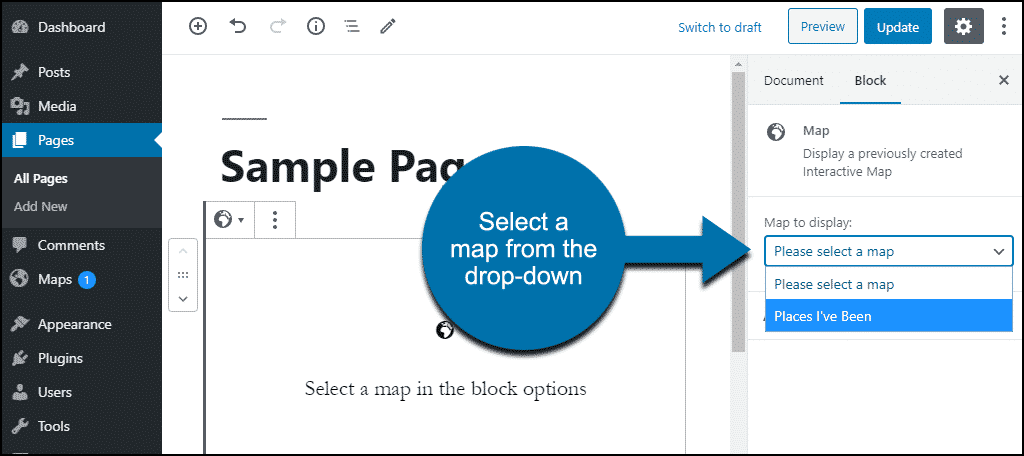
There’s not much reason to use the block when you have only one map. But if you’re managing many, I can see where the drop-down could come in handy.
What Happens if You Uninstall the Interactive Geo Maps Plugin
If you uninstall the plugin, pages and posts that used the plugin will be affected.
- Maps created by the plugin will be deleted.
- The plugin shortcodes will stop working, so the shortcodes themselves will be displayed anywhere they were used.
What’s So Special About a Vector Map?
Vector map images scale, or change size, better than other image file types like .jpg or .png. Those kinds of image files are called “raster” graphics. They’re made up of different colored pixels. Vector graphics, like the maps used by this plugin, are made up of points and paths, like a connect-the-dots drawing.
When you enlarge a raster image, it gets blurry because you’re “stretching” the individual pixels to a larger size. If you enlarge a 72 pixels per inch JPG to 200%, those 72 pixels can’t magically become 144 pixels. So the image quality is compromised.
On the other hand, when you enlarge a vector image, the lines between the points are redrawn, so the image remains smooth. As you might expect, redrawing comes at a cost. Vector images use more computing resources to render than raster images.
Despite the computing cost, the vector format is ideal for maps, logos, charts, etc., that have to adapt to changing display sizes. Vector graphics are the most reliable way to ensure quality for those kinds of layouts.
The Final Word on Maps?
The Google Maps API has been the go-to map plotter for most of us for a very long time. But the recent change to require a credit card to get an API key has a lot of people looking for alternatives.
If you want to create a vector map for free in WordPress, the Interactive Geo Maps plugin is the only way to go. It stands out among the (admittedly few) other vector map plugins available.
And now that you’ve seen how easy it is to use, there’s no reason you can’t create a map today. Choose your map, define your regions, and publish. It doesn’t get any easier than that.
Have you ever attempted manual map integration on your website? Have you come across any other Google Maps API alternatives that we should know about? Let me know in the comments.